Designing a human-centred city or community is a noble goal, but how does one actually go about putting that into practice? And how can you measure the success of such designs?
Beata Klepek, Experience Design lead, spoke to Lucinda Hartley, Co-founder of Neighbourlytics on how on-demand data—measured and interpreted correctly—has the power to drive big picture change.
In conversation
Lucinda Hartley, Co-founder of Neighbourlytics
Beata Klepek, Experience Design Lead at Today
To start off, could you introduce yourself and share a little bit about your career journey so far?
My background is in urban design and planning and I have a very long-standing interest in cities and neighbourhoods in a very nerdy way. I've been fascinated by neighbourhoods and the places we live in even before I became an urban designer. I grew up living in cities around the world, I lived in Kenya and Zimbabwe and the UK all before the age of 14. I think from experiencing all these very diverse places I could see how culture, social life, wellbeing and the opportunities you have access to in life are heavily shaped by where you live.
It's always been a topic of fascination in the back of my mind and I studied urban design because I thought I would have this opportunity to play a role in this great story of shaping neighbourhoods and places for people. Which in theory is true, but the reality I found—at least as a graduate in that profession—was that I spent many years designing the joinery of different concrete details for infrastructure projects. Which someone needs to do and it's really important that the concrete doesn't crack! For example, I worked on the MCG upgrade, and so next time you go there, take a look at the colour of the foam in between the concrete joints. Because that was me who decided whether it was going to be grey or black or white or whichever. Detailing is really important, particularly in design. But I realised very quickly through those jobs, that I was much more interested in the systemic role that cities play in fostering wellbeing and not so much the detail of the infrastructure that gets delivered.
And so I left that and went and worked in Southeast Asia for a number of years. I worked for the United Nations and at that time the Sustainable Development Goals were being developed, and I had the opportunity to work on SDG 11 for cities, which was a really transformational opportunity to understand this very global picture of how governments across the world are working together on setting goals and standards for how we want it to work. At that time, it wasn't guaranteed that cities were going to get a goal, and a lot of what I was working on was the advocacy around why there should be a goal specifically for cities.
At that time I also worked with a bunch of other NGOs on grassroots slum resettlement projects. I don't know how much I contributed to those projects per se, but I learned a huge amount of what it looked like to try and do city building from the bottom up and was particularly inspired in lots of ways by communities with who without land or resources or money or training were getting together and creating neighbourhood improvement projects. And having come from working on the MCG and billion-dollar projects, it was inspiring to see what could be created with human energy and capital.
When I eventually came back to Australia I think I was particularly interested to see what it would look like to have a more community-led approach to city building in Australia, because I think for all our city livability accolades, we have a genuinely top-down approach to delivery. We have great professionals and great ideas, but limited capacity for people to really put their fingerprints on things and make it their own.
I was interested to see what that model would look like here. And that led to starting CoDesign Studio—which is almost 10 years ago now—as a social enterprise with the purpose of helping to build more authentic placemaking by being a conduit between community and other decision-makers—government and the property sector—and helping to shape projects that had a greater level of community participation and voice.
It's actually not very long ago, but at that time, placemaking was not a thing, tactical urbanism was definitely not a thing, and a lot of these ideas around being participatory and people-centred were foreign. Foreign to the point that we were always seen as being a little bit on the fringe and a little bit left of centre.
I love that now those ideas are very mainstream in urban development. And that was definitely one of CoDesign's goals was to not just deliver the projects, but to help change the system and build awareness that we could actually do better. I'm loving continuing to see that conversation grow in Australia.
Through CoDesign, we worked on more than 100 neighbourhood improvement projects across the country and with a bunch of different Citymakers and learned a lot about how to work more collaboratively with communities, but also how to work with decision-makers on strengthening their processes around human-centred design as well.
But there became a point where I became more interested in how do we actually drive the really big picture change? So we really had a lot of success at the project level, but if you look at the grand scale of things, we still have loneliness as a leading cause of death, we still have huge inequality and growing inequality in our cities. And what was it about it that made it so hard for us to invest in places that led to better human outcomes?
When we really looked at that problem, it seemed that there's very little human data when it comes to city-making. We have increasingly great information about water, traffic, building heights, units of apartments sold, property pricing, and even the metres squared of community and physical infrastructure delivered. But when it comes to the social life, the cultural life, people's level of satisfaction and wellbeing, we're really often working in the dark or we're working with very old demographics statistics that just aren't as relevant when cities are growing and changing dynamically so fast.
We became increasingly interested and asked, “what if we could quantify that”. Because what gets measured is what gets changed. A lot of the reason that there's been such a focus on roads and traffic and city building in the last 30-40 years, is because it's something that's really easy to quantify. For example, “here's the bottlenecks. If we did X, we could unblock that bottleneck and create Y.”
It might seem a little bit simplistic, but if we could take that same quantitative approach to human dynamics and say, “look, here's where the issues are”. We would have better visibility on what's happening in communities and have the insight that we needed to shift the dial on different outcomes.
So that led somewhat accidentally to Neighbourlytics. My co-founder Jessica and I were talking about these topics when I was on maternity leave and living in the Pacific with my family in Samoa. We ended up applying for an accelerator programme to see whether we could get some support to put some technology behind these ideas, which were genuinely ideas at that point in time.
We didn't really know, but we thought there must be a lot of data available about human behaviour embedded in Google Maps and social media and other things like that. But at that point, we didn’t really know that, and against our expectations, we were accepted into the SheStarts accelerator run by Blue Chilli.
So we had this incredible opportunity to actually test that technology and build out an MVP. And it's really just grown so quickly from there. We had customers wanting our products right from day one when it was just an idea.
Neighbourlytics' purpose is to create cities people love and feel connected to. Our goal is to be in 100 cities within three years, to really shift the dial on the way that we measure and account for city-making, and to use human-centred data to help inform human-centred decisions. In just three years it's come a long way. We're working in 12 countries and thousands of neighbourhoods. It's very exciting but challenging as well.
I became more interested in how do we actually drive the really big picture change? So we really had a lot of success at the project level, but if you look at the grand scale of things, we still have loneliness as a leading cause of death, we still have huge inequality and growing inequality in our cities. And what was it about it that made it so hard for us to invest in places that led to better human outcomes?
Lucinda Hartley
It's amazing what you've already done within just three years. I'd love to know what the steps looked like from the start from getting a grant through to you putting an MVP out into the market.
I guess there are two ways of trying to solve the problem. It's working out, what should we be measuring? So what are the indicators of success that we should be thinking about? And then, what can we actually measure? What data is there?
It turns out the volume of data is in no way near the problem. The more that we scratch the surface on what's available in terms of big data analytics, it's enormous. Whether it's looking at cell phone presence data, or social media data or maps data or events, data is not the problem.
We had a very big vision for this from day one and we wanted data sets that were globally available. We didn't want to look at say Census data, because although that can be useful for some contexts, it's country-specific and it’s not real-time.
We wanted to look at data that was real-time and globally available, so we put these filters on the types of data we would access. We started with a couple of data sets that could be accessed free and initially worked with BlueChilli's team to build some very simple technology to scrape that data. Our very first reports were actually just spreadsheets, aggregating the metrics and describing what we found. So at that very early stage, there wasn’t any sophisticated analytics. It was just about data like, “In Moonee Ponds, there are 37% more cafes than there are in Parkville.” People don't actually have that information, so that was useful.
Then we hired our head of analytics, Gala Camacho Ferrari, who's still with us and was our very first employee, well before Jessica and I were paid in the business. So we scraped together the money that we had to hire our absolutely brilliant optimization mathematician and data scientist who's then built all of our algorithms from scratch. Really, we were able to start to move once we hired Gala because getting the data is not really the problem, but what you do with it and how you understand cities through that data is very complicated. It's actually very mathematical as well, so by combining I guess, Jessica and my urban design expertise with Gala's mathematics, we were able to come up with some really interesting ways of understanding city life.
... getting the data is not really the problem, but what you do with it and how you understand cities through that data is very complicated.
Lucinda Hartley
Tap to explore content
I'm curious, when you're looking at that data that's available, how do you quantify or how do you make a definition of what the quality of life and wellbeing of a place looks like?
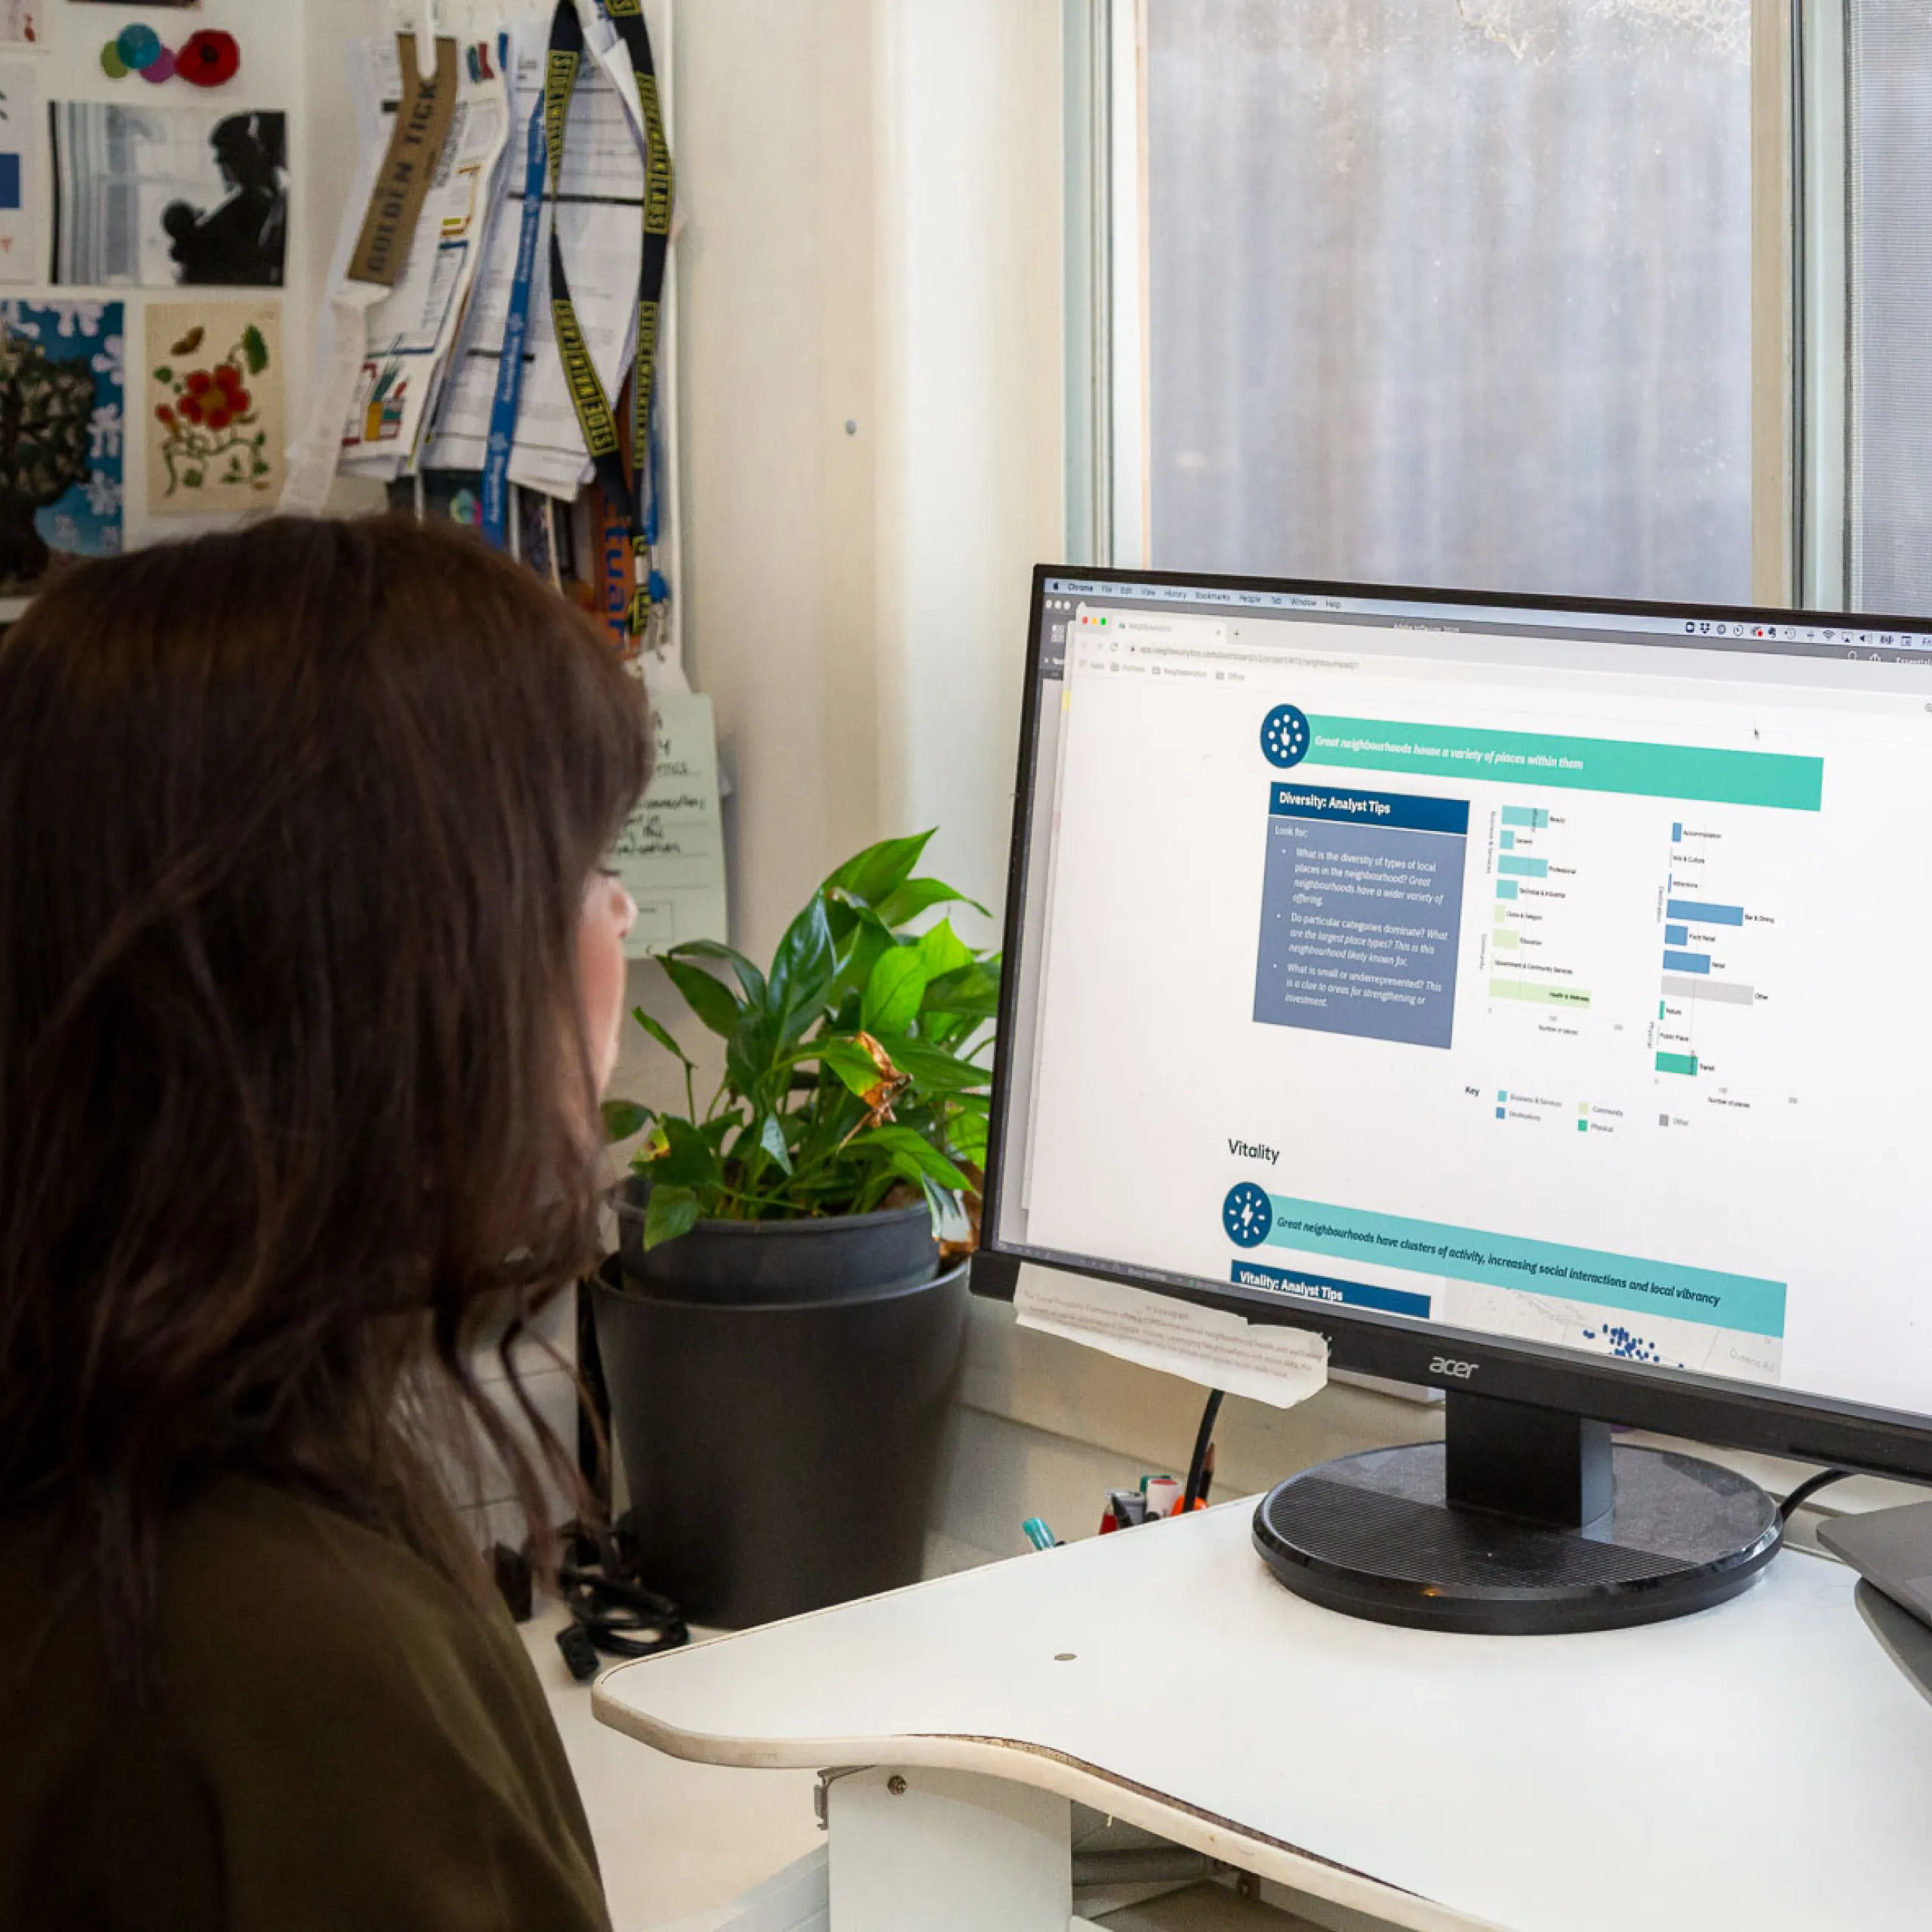
There are probably two ways to look at that, and the way that we've done that is actually to look at what decades of social research says about that. So we haven't defined the indicators ourselves. There's very good research out there that social scientists particularly have looked at over a long time to define what is it that a great neighbourhood needs to have success. It needs to have a certain level of parks, it needs to have social connection, it needs to have economic vibrancy, it needs to have arts and culture. In the initial days, we just had three, but now we have 13 indicators of 39 measures of what that quality of life needs to look like.
In some ways though the measures haven’t been defined. Where the social sciences are really limited is that they don't have the data to support it. So they might be able to measure it in this city where they've got data, but they can't apply that same framework in another country or another city. And they often can't look at it through the lens of behaviour, because the data that they're using is static like the Census.
So they'll describe employment levels, whereas Neighbourlytics is less interested in the number of people employed, but people's level of participation and engagement with employment as a behaviour. So questions like, “Are people going to work? Are they spending time there? Are they working from home?”
We haven't tried to reinvent the definition of place performance, but we have done a lot of really creative things with how we captured that data to measure it.
Neighbourlytics is less interested in the number of people employed, but people's level of participation and engagement with employment as a behaviour. So questions like, “Are people going to work? Are they spending time there? Are they working from home?”
Lucinda Hartley
Because you capture data around the world, not just Australia, do you feel like you need some cultural and local context in order to analyse those behaviours?
To some extent, yes. We do recalibrate whenever we enter a new geography, but the measures that we have chosen are the things that are fairly agnostically agreed. They're things that are baked into the SDGs or other measures like that, that are seen as global standards. So one measure is “You will have a better outcome in life if you have access to healthcare.” But what type of health care, what diversity of healthcare, what amplitude of health care, what engagement you have with healthcare will vary significantly in different contexts. So the attributes of the data will change and that's where we need the calibration to understand what good looks like, but the presence of that as a measure can be consistently applied.
In your words, what would the value of Neighbourlytics bring to cities and communities?
We work with two broad customer segments—government and the property sector—and they use the same product for different applications. When we work with the property sector, one of their core values is creating livability. The value of what they are creating is to do with, not so much the houses that they sell, but the livability. Their customers are very savvy and very driven by looking for developments that have those kinds of qualities. So we help reduce their risk and give them more certainty than they are looking to either create a neighbourhood that is livable or measure how well their existing neighbourhoods are going, by providing some insight, because our data does go down right down to the local neighbourhood level. Often we think we have created a really great place, but we don't actually have any local intelligence to understand and get visibility on what that local life is.
The same data can be used if we're trying to understand retail and main streets and get visibility on what people really value in those neighbourhoods. That's particularly important in the retail sector where it might seem that people really particularly like a shopping centre that they responded positively in an exit survey, for example. But then when we look at their whole of behaviour, we find that it's actually that the car boot sale at the local primary school is way more popular than the shopping centre. So even though they gave you a positive response on the survey, when we look at the whole neighbourhood, there are these other competing priorities on people's time, particularly in an experience economy, at least in a pre-COVID experience economy.
When we work with government, the questions can be similar, but it's often about local economic development. People often know that a local main street is failing, but they don't have very good optics on why. If we understand that these kinds of businesses are typically doing well or that this neighbourhood is doing well, not so much because of the retail, but because it has a park next door, or this mix of business types is doing better than others, then we start to provide clues on why a neighbourhood might be doing better or where the opportunities are for improvement.
We often also work with governments on doing things like understanding and mapping where social connection is occurring across the city, and are there neighbourhoods that are more socially connected than others? That's often a big driver in terms of policy and other levers that might be around services and infrastructure.
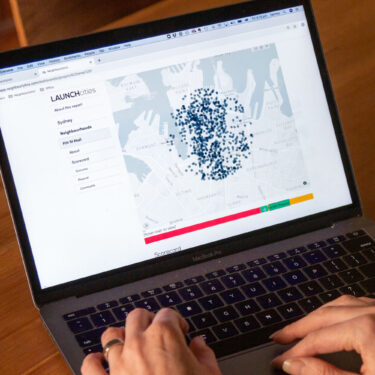
With measures such as the social connectedness between people, are you able to share a little bit about how the product works to uncover those kinds of things?
We measure data about places and people's interaction with the place, not actually data about individual people or their personal preferences. So we don't actually look at any personal data. For example, if you ask my opinion about my own wellbeing and fitness, and you ask me how often I go to the gym, I will probably tell you what I want you to think about me rather than what I actually do. So I will tell you that I go three to four times a week, which in an ideal world I do that, but my cell phone location would show that I only go once a week. Now that's not giving any data about my age, demographic, values or preferences. But people vote with their feet and their location is actually a very good predictor of behaviour. We look at a lot of location and place data in that regard.
When we're trying to understand social connection, we don't look at whether my phone talked to your phone or whether we're friends on Facebook as a proxy for connection. That would be useful statistics, but it's also very sensitive data to handle from a privacy perspective. Instead, we look at what are the types of facilities and places in the neighbourhood that would promote social connection and how much do people actually engage with those? In one neighbourhood, you might have high levels of volunteering organisations and social support services and bars and cafes and other places that are designed to help connect people; that would be one level of data.
We look at data on three levels; places, activities, and then stories. So if we want to understand social connection through that lens, we would look at what places and opportunities are there for connection in the first place. And there will be some that do that more than others.
Then we will look at whether those places are activated. Are there activities and events and programs going on that would attract and drive people to those places?
Then we would look at the stories. So are people actually interacting with those places? Are they attending the events? Are they checking in, liking, posting about, telling stories about these venues or events that occurred?
So by taking that composition of data, we can then start to measure how well the social connection is likely to perform and also its type.
When we're trying to understand social connection, we don't look at whether my phone talked to your phone or whether we're friends on Facebook as a proxy for connection. That would be useful statistics, but it's also very sensitive data to handle from a privacy perspective. Instead, we look at what are the types of facilities and places in the neighbourhood that would promote social connection and how much do people actually engage with those?
I'm wondering what has happened with all the data in light of COVID happening?
We've seen a big shift in the data, but also a big shift in the questions that our customers are asking. Pre-COVID the things that we would commonly ask questions about were around behavioural values, but often for the objective of helping to define, say, place branding or the value proposition for a new property development or shopping centre, and those are important things because places have characters.
Now people are asking, “What can your data tell us about local economic resilience? What can you tell us about community wellbeing?” In lots of ways, those are chunkier and higher-order questions that we also want to be diving into and answering, but they are more complex to answer and you need more data and the product needs to be more complex to look at that.
We currently have a new product called the Neighbourhood Barometer, which looks explicitly at five dimensions of economic resilience. And while we were always looking at dimensions of economy and behavioural economics, we have gone deeper into those because a lot of customer requests—particularly from state government—have been around how do we understand in real-time or in recent on-demand time, how local economies have been impacted differently across the city, because we know that it's not a one size fits all scenario and some neighbourhoods will be more vulnerable than others in certain industries.
So we're noticing a shift in customer questions, which is actually quite exciting and a big opportunity for us in lots of ways.
The other thing that we're noticing in the actual data is huge shifts in behaviour. In Sydney, there's been a 40 to 60% increase in the use of public space in our data and there's been a 90% decrease in events. We have lots of longitudinal data for Sydney CBD because we've been measuring it over time. In an average month, we'd have 1,200 to 1,500 events, which is a lot. That's actually more than you would have in Barcelona, Brooklyn or New York, which are other places that we've been measuring over time. Then in April in Sydney, there were 126 events. So there's a lot less activity, but the activity hasn't ceased completely.
What we're then seeing is much higher volumes of data in the suburbs, and we're seeing a greater prevalence of online events and activities going on. Now obviously they can be accessed anywhere, but we can see that shift occurring online. People's digital footprint in the suburbs is bigger now, they're visiting local cafes more for example.
The other thing that we're noticing in the actual data is huge shifts in behaviour. In Sydney, there's been a 40 to 60% increase in the use of public space in our data and there's been a 90% decrease in events.
It's super fascinating how something unexpected completely changed the way that your product is being used. I'm wondering, how would you like to see that data being used in five years time?
We always come back to the premise that you can't manage what you can't measure. So if right now we are making decisions about the future of our cities and we're wanting to create places for people that are human-centred cities—which are important objectives—but I think often there’s very little visibility on what that actually means or how it would actually be quantified and tracked over time.
I love that there is a thirst for measurement again that didn't exist a couple of years ago. But if every neighbourhood, every council, every developer, and every project measures place differently, then we will never actually know what good looks like or work towards any collective outcome because everyone's measuring different things.
Our goal for Neighbourlytics is to really help steer the industry around standardisation of measurement in the same way perhaps the Green Building Council did for the sustainability industry.
And we would like to see the same for social wellbeing, that you actually have a standardised way of validating whether a neighbourhood was trending in the right direction. And by doing that, I think we get visibility on where we can improve and amplify, but also primarily celebrate the strengths of what we're doing really well.
Neighbourlytics is a strengths-based framework—it's not about measuring the deficits—it's about celebrating the strengths. I think sometimes we’re so focused on trying to find the thing that we're not doing right to fix, that we forget that we're doing so many good things.
Neighbourlytics is a strengths-based framework—it's not about measuring the deficits—it's about celebrating the strengths. I think sometimes we’re so focused on trying to find the thing that we're not doing right to fix, that we forget that we're doing so many good things.
That's definitely a very common human fault to focus on the gaps in expectations, so it's really good to hear that Neighbourlytics is more centred on positive aspects. Speaking of positivity, is there an instance where you've been really proud of the way that the data has been used on products?
We did some work with the Australian Financial Review , looking at the impact of the Sydney bushfires on behaviour and lifestyle in Sydney and how that data could be used to get very immediate, very granular insights that would help support local business changes. That's a case study I keep coming back to, mainly because I think it has a lot of relevance in a COVID environment where things are moving really quickly. If things are relatively stable—and I would say in a pre-COVID, pre-bushfire world, things are pretty stable—you could make a decision this year and next year it might be similar, but the new context of bushfires and COVID, who knows what next month is going to do? And so real-time data becomes even more important.
In this study, we were particularly looking at three quite different suburbs, Mosman, Pyrmont, and Bankstown. We initially did a baseline assessment of their wellbeing, strengths, and found Mosman's strength is restaurants and public space, Pyrmont is restaurants and other destinations, and Bankstown is community. Now that might seem like a stereotype, but that was validated in our data, and then three months later when we did the same reassessment of those neighbourhoods during the thick of the bush fires in December, found that in Pyrmont there was 100% decrease in the use of out public space, while there was and a 250% increase in indoor fitness . In places like Bankstown, there was a similar 100% decrease in outdoor fitness, but no increase in indoor fitness. And so that might suggest that people just aren't exercising, whereas in Pyrmont, they're going to the gym.
When you've got street level and block level information about how different businesses and activities are performing, it helps agencies who are working with business improvement districts and councils to then make very specific decisions. In somewhere like Bankstown, we need to think about how it looks like people are not exercising. That's going to become a health risk, so maybe we need to provide ways for people to safely exercise indoors because we were seeing high levels of physical activity, but it was outdoors and it hasn't translated to indoors. So what could we do? We can provide information that gives you very specific human-centred data about how decisions would need to be made in a prioritised way at a neighbourhood level.
I like the idea that it's very real-time and reacting to things as they happen as opposed to other forms of data collection, where it might be collected for quite some time and then released. It's a more proactive way of being able to use that data to make changes as the changes are happening.
Yes, often I think we have a bit of a one size fits all scenario. We might see that beauty stores are forced to close during COVID for example. There are going to be neighbourhoods where that is a dominant employer and that service is a dominant activator of those streets and they will be more vulnerable and need a different type of support than areas where it's not. I think being able to see those things helps us budget more effectively, prioritise and make decisions that are very relevant.
I read in an article that both yourself and Jessica didn't come from a technical background, and I'm always so impressed by people who perhaps don't have a technical background then end up diving into a project which is so technical on many levels. How have you found the journey?
My summary of it would be I've spent my whole career working with designers and I'm a designer, so working with data scientists, engineers and mathematicians is so refreshing by comparison. It's just a very different way of thinking.
Jess and I really know the customer problem because we've been that customer, we've lived that problem for 20 years and we understand what our customers really need. So we can take that domain knowledge and combine it with really interesting analytics.
If someone was trying to run Neighbourlytics without that, they wouldn't get very far because a city is not an algorithm. You can't just look at the data and say, “That's what it means.” You really need that design interpretation on top. So that thinking is baked into the way that we develop our algorithms.
It's a big shift and even five years ago, if you'd said that I would be working in data science, I would have thought that that was a ridiculous proposition. But I love the journey and I really love working with a very different type of team than I've worked with previously.
We can provide information that gives you very specific human-centred data about how decisions would need to be made in a prioritised way at a neighbourhood level.
Thank you so much for sharing today. Is there anything else that you'd like to share with us?
The only thing I would say is that I think we’re at a point where we're thinking about what post-COVID cities look like. We've had a permanent shift to localisation with more people working from home and living locally. We're seeing that behaviour pattern in the data, but everyone's experienced it as well. I think we've got an opportunity now to think about what kinds of cities we need that are going to have a very different lifestyle than they did previously. And that's really exciting that maybe it takes a pandemic for us to disrupt the way that we create things. We're excited about diving into that problem with our customers and collaborators and thinking about what the future of cities looks like.
I think we’re at a point where we're thinking about what post-COVID cities look like. We've had a permanent shift to localisation with more people working from home and living locally. We're seeing that behaviour pattern in the data, but everyone's experienced it as well. I think we've got an opportunity now to think about what kinds of cities we need that are going to have a very different lifestyle than they did previously. And that's really exciting that maybe it takes a pandemic for us to disrupt the way that we create things.
